


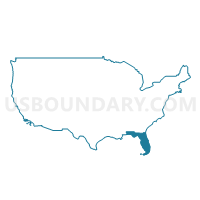
Congressional District 9, Florida
About
Outline

Summary
| Unique Area Identifier | 118993 |
| Name | Congressional District 9 |
| State | Florida |
| Area (square miles) | 799.84 |
| Land Area (square miles) | 621.26 |
| Water Area (square miles) | 178.58 |
| % of Land Area | 77.67 |
| % of Water Area | 22.33 |
| Latitude of the Internal Point | 28.10416710 |
| Longtitude of the Internal Point | -82.47523450 |
| Total Population | 753,549 |
| Total Housing Units | 355,472 |
| Total Households | 307,731 |
| Median Age | 42.3 |
Maps

Graphs
Select a template below for downloading or customizing gragh for Congressional District 9, Florida


Neighbors
Neighoring 111th Congressional District (by Name) Neighboring 111th Congressional District on the Map
- Congressional District 10, FL
- Congressional District 11, FL
- Congressional District 12, FL
- Congressional District 5, FL
Top 10 Neighboring County (by Population) Neighboring County on the Map
- Hillsborough County, FL (1,229,226)
- Pinellas County, FL (916,542)
- Polk County, FL (602,095)
- Pasco County, FL (464,697)
- Hernando County, FL (172,778)
Top 10 Neighboring County Subdivision (by Population) Neighboring County Subdivision on the Map
- Tampa CCD, Hillsborough County, FL (625,570)
- St. Petersburg CCD, Pinellas County, FL (382,308)
- Clearwater CCD, Pinellas County, FL (319,594)
- Lakeland CCD, Polk County, FL (249,148)
- Brandon CCD, Hillsborough County, FL (166,638)
- New Port Richey CCD, Pasco County, FL (163,273)
- Tarpon Springs CCD, Pinellas County, FL (132,083)
- Keystone-Citrus Park CCD, Hillsborough County, FL (128,990)
- Wimauma-Riverview CCD, Hillsborough County, FL (123,563)
- Spring Hill CCD, Hernando County, FL (120,829)
Top 10 Neighboring Place (by Population) Neighboring Place on the Map
- Tampa city, FL (335,709)
- Clearwater city, FL (107,685)
- Brandon CDP, FL (103,483)
- Spring Hill CDP, FL (98,621)
- Lakeland city, FL (97,422)
- Town 'n' Country CDP, FL (78,442)
- Largo city, FL (77,648)
- Riverview CDP, FL (71,050)
- Palm Harbor CDP, FL (57,439)
- Wesley Chapel CDP, FL (44,092)
Top 10 Neighboring Unified School District (by Population) Neighboring Unified School District on the Map
- Hillsborough County School District, FL (1,229,226)
- Pinellas County School District, FL (916,542)
- Polk County School District, FL (602,095)
- Pasco County School District, FL (464,697)
- Hernando County School District, FL (172,778)
Top 10 Neighboring State Legislative District Lower Chamber (by Population) Neighboring State Legislative District Lower Chamber on the Map
- State House District 61, FL (242,396)
- State House District 56, FL (192,632)
- State House District 44, FL (171,652)
- State House District 64, FL (165,492)
- State House District 60, FL (162,605)
- State House District 62, FL (162,165)
- State House District 47, FL (157,056)
- State House District 63, FL (156,183)
- State House District 57, FL (148,460)
- State House District 45, FL (146,618)
Top 10 Neighboring State Legislative District Upper Chamber (by Population) Neighboring State Legislative District Upper Chamber on the Map
- State Senate District 10, FL (565,921)
- State Senate District 15, FL (560,770)
- State Senate District 12, FL (531,959)
- State Senate District 17, FL (456,960)
- State Senate District 11, FL (433,661)
- State Senate District 16, FL (431,916)
- State Senate District 18, FL (404,822)
- State Senate District 13, FL (394,766)
Top 10 Neighboring Census Tract (by Population) Neighboring Census Tract on the Map
- Census Tract 115.17, Hillsborough County, FL (9,220)
- Census Tract 102.09, Hillsborough County, FL (9,162)
- Census Tract 273.10, Pinellas County, FL (8,634)
- Census Tract 132.05, Hillsborough County, FL (8,030)
- Census Tract 102.05, Hillsborough County, FL (7,637)
- Census Tract 116.07, Hillsborough County, FL (7,558)
- Census Tract 115.06, Hillsborough County, FL (7,333)
- Census Tract 115.07, Hillsborough County, FL (7,312)
- Census Tract 265, Pinellas County, FL (7,038)
- Census Tract 122.07, Hillsborough County, FL (6,761)
Top 10 Neighboring 5-Digit ZIP Code Tabulation Area (by Population) Neighboring 5-Digit ZIP Code Tabulation Area on the Map
- 33647, FL (55,034)
- 33511, FL (52,003)
- 33612, FL (44,601)
- 33810, FL (44,254)
- 34668, FL (42,619)
- 33617, FL (41,443)
- 34655, FL (38,464)
- 33624, FL (37,457)
- 34698, FL (37,240)
- 33594, FL (32,677)
Data
Demographic, Population, Households, and Housing Units
** Data sources from census 2010 **
Show Data on Map
Download Full List as CSV
Download Quick Sheet as CSV
| Subject | This Area | Florida | National |
|---|---|---|---|
| POPULATION | |||
| Total Population Map | 753,549 | 18,801,310 | 308,745,538 |
| POPULATION, HISPANIC OR LATINO ORIGIN | |||
| Not Hispanic or Latino Map | 650,800 | 14,577,504 | 258,267,944 |
| Hispanic or Latino Map | 102,749 | 4,223,806 | 50,477,594 |
| POPULATION, RACE | |||
| White alone Map | 640,878 | 14,109,162 | 223,553,265 |
| Black or African American alone Map | 43,005 | 2,999,862 | 38,929,319 |
| American Indian and Alaska Native alone Map | 2,442 | 71,458 | 2,932,248 |
| Asian alone Map | 25,122 | 454,821 | 14,674,252 |
| Native Hawaiian and Other Pacific Islander alone Map | 458 | 12,286 | 540,013 |
| Some Other Race alone Map | 23,205 | 681,144 | 19,107,368 |
| Two or More Races Map | 18,439 | 472,577 | 9,009,073 |
| POPULATION, SEX | |||
| Male Map | 363,957 | 9,189,355 | 151,781,326 |
| Female Map | 389,592 | 9,611,955 | 156,964,212 |
| POPULATION, AGE (18 YEARS) | |||
| 18 years and over Map | 587,622 | 14,799,219 | 234,564,071 |
| Under 18 years | 165,927 | 4,002,091 | 74,181,467 |
| POPULATION, AGE | |||
| Under 5 years | 40,621 | 1,073,506 | 20,201,362 |
| 5 to 9 years | 45,321 | 1,080,255 | 20,348,657 |
| 10 to 14 years | 49,465 | 1,130,847 | 20,677,194 |
| 15 to 17 years | 30,520 | 717,483 | 12,954,254 |
| 18 and 19 years | 16,996 | 510,899 | 9,086,089 |
| 20 years | 8,235 | 258,030 | 4,519,129 |
| 21 years | 8,186 | 248,602 | 4,354,294 |
| 22 to 24 years | 24,737 | 722,126 | 12,712,576 |
| 25 to 29 years | 41,186 | 1,179,227 | 21,101,849 |
| 30 to 34 years | 40,354 | 1,110,318 | 19,962,099 |
| 35 to 39 years | 47,159 | 1,178,467 | 20,179,642 |
| 40 to 44 years | 53,429 | 1,252,787 | 20,890,964 |
| 45 to 49 years | 60,118 | 1,401,202 | 22,708,591 |
| 50 to 54 years | 57,240 | 1,340,291 | 22,298,125 |
| 55 to 59 years | 50,542 | 1,202,418 | 19,664,805 |
| 60 and 61 years | 19,425 | 458,751 | 7,113,727 |
| 62 to 64 years | 28,203 | 676,499 | 9,704,197 |
| 65 and 66 years | 15,860 | 397,917 | 5,319,902 |
| 67 to 69 years | 21,879 | 561,316 | 7,115,361 |
| 70 to 74 years | 29,359 | 768,707 | 9,278,166 |
| 75 to 79 years | 24,617 | 615,514 | 7,317,795 |
| 80 to 84 years | 20,306 | 482,023 | 5,743,327 |
| 85 years and over | 19,791 | 434,125 | 5,493,433 |
| MEDIAN AGE BY SEX | |||
| Both sexes Map | 42.30 | 40.70 | 37.20 |
| Male Map | 41.00 | 39.40 | 35.80 |
| Female Map | 43.40 | 42.10 | 38.50 |
| HOUSEHOLDS | |||
| Total Households Map | 307,731 | 7,420,802 | 116,716,292 |
| HOUSEHOLDS, HOUSEHOLD TYPE | |||
| Family households: Map | 200,662 | 4,835,475 | 77,538,296 |
| Husband-wife family Map | 152,416 | 3,457,149 | 56,510,377 |
| Other family: Map | 48,246 | 1,378,326 | 21,027,919 |
| Male householder, no wife present Map | 13,585 | 373,284 | 5,777,570 |
| Female householder, no husband present Map | 34,661 | 1,005,042 | 15,250,349 |
| Nonfamily households: Map | 107,069 | 2,585,327 | 39,177,996 |
| Householder living alone Map | 85,571 | 2,021,781 | 31,204,909 |
| Householder not living alone Map | 21,498 | 563,546 | 7,973,087 |
| HOUSEHOLDS, HISPANIC OR LATINO ORIGIN OF HOUSEHOLDER | |||
| Not Hispanic or Latino householder: Map | 277,711 | 6,087,554 | 103,254,926 |
| Hispanic or Latino householder: Map | 30,020 | 1,333,248 | 13,461,366 |
| HOUSEHOLDS, RACE OF HOUSEHOLDER | |||
| Householder who is White alone | 272,454 | 5,918,746 | 89,754,352 |
| Householder who is Black or African American alone | 15,841 | 1,005,589 | 14,129,983 |
| Householder who is American Indian and Alaska Native alone | 916 | 25,704 | 939,707 |
| Householder who is Asian alone | 7,725 | 145,808 | 4,632,164 |
| Householder who is Native Hawaiian and Other Pacific Islander alone | 136 | 3,858 | 143,932 |
| Householder who is Some Other Race alone | 6,173 | 192,042 | 4,916,427 |
| Householder who is Two or More Races | 4,486 | 129,055 | 2,199,727 |
| HOUSEHOLDS, HOUSEHOLD TYPE BY HOUSEHOLD SIZE | |||
| Family households: Map | 200,662 | 4,835,475 | 77,538,296 |
| 2-person household Map | 92,628 | 2,183,933 | 31,882,616 |
| 3-person household Map | 45,195 | 1,086,320 | 17,765,829 |
| 4-person household Map | 38,045 | 874,904 | 15,214,075 |
| 5-person household Map | 15,923 | 411,851 | 7,411,997 |
| 6-person household Map | 5,641 | 165,397 | 3,026,278 |
| 7-or-more-person household Map | 3,230 | 113,070 | 2,237,501 |
| Nonfamily households: Map | 107,069 | 2,585,327 | 39,177,996 |
| 1-person household Map | 85,571 | 2,021,781 | 31,204,909 |
| 2-person household Map | 18,197 | 459,229 | 6,360,012 |
| 3-person household Map | 2,223 | 66,366 | 992,156 |
| 4-person household Map | 710 | 25,473 | 411,171 |
| 5-person household Map | 225 | 7,379 | 126,634 |
| 6-person household Map | 85 | 2,998 | 48,421 |
| 7-or-more-person household Map | 58 | 2,101 | 34,693 |
| HOUSING UNITS | |||
| Total Housing Units Map | 355,472 | 8,989,580 | 131,704,730 |
| HOUSING UNITS, OCCUPANCY STATUS | |||
| Occupied Map | 307,731 | 7,420,802 | 116,716,292 |
| Vacant Map | 47,741 | 1,568,778 | 14,988,438 |
| HOUSING UNITS, OCCUPIED, TENURE | |||
| Owned with a mortgage or a loan Map | 148,032 | 3,348,864 | 52,979,430 |
| Owned free and clear Map | 70,933 | 1,650,115 | 23,006,644 |
| Renter occupied Map | 88,766 | 2,421,823 | 40,730,218 |
| HOUSING UNITS, VACANT, VACANCY STATUS | |||
| For rent Map | 12,359 | 371,626 | 4,137,567 |
| Rented, not occupied Map | 510 | 15,438 | 206,825 |
| For sale only Map | 7,553 | 198,232 | 1,896,796 |
| Sold, not occupied Map | 1,196 | 31,911 | 421,032 |
| For seasonal, recreational, or occasional use Map | 15,510 | 657,070 | 4,649,298 |
| For migrant workers Map | 136 | 1,541 | 24,161 |
| Other vacant Map | 10,477 | 292,960 | 3,652,759 |
| HOUSING UNITS, OCCUPIED, AVERAGE HOUSEHOLD SIZE BY TENURE | |||
| Total: Map | 2.42 | 2.48 | 2.58 |
| Owner occupied Map | 2.44 | 2.47 | 2.65 |
| Renter occupied Map | 2.37 | 2.49 | 2.44 |
| HOUSING UNITS, OCCUPIED, TENURE BY RACE OF HOUSEHOLDER | |||
| Owner occupied: Map | 218,965 | 4,998,979 | 75,986,074 |
| Householder who is White alone Map | 200,526 | 4,252,583 | 63,446,275 |
| Householder who is Black or African American alone Map | 7,315 | 480,760 | 6,261,464 |
| Householder who is American Indian and Alaska Native alone Map | 498 | 14,279 | 509,588 |
| Householder who is Asian alone Map | 5,626 | 98,804 | 2,688,861 |
| Householder who is Native Hawaiian and Other Pacific Islander alone Map | 78 | 1,917 | 61,911 |
| Householder who is Some Other Race alone Map | 2,458 | 81,491 | 1,975,817 |
| Householder who is Two or More Races Map | 2,464 | 69,145 | 1,042,158 |
| Renter occupied: Map | 88,766 | 2,421,823 | 40,730,218 |
| Householder who is White alone Map | 71,928 | 1,666,163 | 26,308,077 |
| Householder who is Black or African American alone Map | 8,526 | 524,829 | 7,868,519 |
| Householder who is American Indian and Alaska Native alone Map | 418 | 11,425 | 430,119 |
| Householder who is Asian alone Map | 2,099 | 47,004 | 1,943,303 |
| Householder who is Native Hawaiian and Other Pacific Islander alone Map | 58 | 1,941 | 82,021 |
| Householder who is Some Other Race alone Map | 3,715 | 110,551 | 2,940,610 |
| Householder who is Two or More Races Map | 2,022 | 59,910 | 1,157,569 |
| HOUSING UNITS, OCCUPIED, TENURE BY HISPANIC OR LATINO ORIGIN OF HOUSEHOLDER | |||
| Owner occupied: Map | 218,965 | 4,998,979 | 75,986,074 |
| Not Hispanic or Latino householder Map | 202,551 | 4,274,313 | 69,617,625 |
| Hispanic or Latino householder Map | 16,414 | 724,666 | 6,368,449 |
| Renter occupied: Map | 88,766 | 2,421,823 | 40,730,218 |
| Not Hispanic or Latino householder Map | 75,160 | 1,813,241 | 33,637,301 |
| Hispanic or Latino householder Map | 13,606 | 608,582 | 7,092,917 |
| HOUSING UNITS, OCCUPIED, TENURE BY HOUSEHOLD SIZE | |||
| Owner occupied: Map | 218,965 | 4,998,979 | 75,986,074 |
| 1-person household Map | 53,811 | 1,227,080 | 16,453,569 |
| 2-person household Map | 85,701 | 1,975,675 | 27,618,605 |
| 3-person household Map | 33,599 | 750,284 | 12,517,563 |
| 4-person household Map | 28,918 | 605,447 | 10,998,793 |
| 5-person household Map | 11,306 | 268,036 | 5,057,765 |
| 6-person household Map | 3,707 | 104,017 | 1,965,796 |
| 7-or-more-person household Map | 1,923 | 68,440 | 1,373,983 |
| Renter occupied: Map | 88,766 | 2,421,823 | 40,730,218 |
| 1-person household Map | 31,760 | 794,701 | 14,751,340 |
| 2-person household Map | 25,124 | 667,487 | 10,624,023 |
| 3-person household Map | 13,819 | 402,402 | 6,240,422 |
| 4-person household Map | 9,837 | 294,930 | 4,626,453 |
| 5-person household Map | 4,842 | 151,194 | 2,480,866 |
| 6-person household Map | 2,019 | 64,378 | 1,108,903 |
| 7-or-more-person household Map | 1,365 | 46,731 | 898,211 |
Loading...